Data analysts are often interested in knowing if two categorical variables in a dataset share a significant relationship when studying the data. Sometimes, a population is defined by many variables and the big question is whether these variables are dependent or independent.
In this tutorial, I will be going over the Chi Square test and its implementation using R.
What is the Chi Square Test of Independence?
The Chi Square test allows you to estimate whether two variables are associated or related by a function, in simple words, it explains the level of independence shared by two categorical variables. For a Chi Square test, you begin by making two hypotheses.
- H0: The variables are not associated i.e., are independent. (NULL Hypothesis)
- H1: The variables are associated, i.e., are dependent. (Alternative Hypothesis)
When conducted, the test gives you a “p” value as the result, using which you conclude whether your hypothesis of independence is true or not. In simple words, the “p” value is just the likelihood of your variables being independent. It is often confusing for beginners to remember whether the “p” value measures the probability of dependence or independence. For now, you can just remember “pi”, i.e., p for independence.
If the “p” value is above 0.05, it means the probability of independence is fairly high and sufficient enough to conclude that the variables do not have a relationship. However, anything below 0.05 means that the probability of independence is insignificantly low, and the variables share a strong correlation.
At this point, you may be wondering why 0.05 and why not 0.3 or some other number. Statisticians gave us this number and it is widely used simply because it is common to use 0.05 as a defining point. However, you may use a smaller “p” value to ensure that variables passing the chi square test share a very strong correlation. Alternatively, a higher “p” value could pass even those variables that share a weak correlation.
However, in this tutorial, I will be using the 0.05 “p” value to describe variables as being dependent or independent.
Conducting a Chi Square Test in R
First off, I’ll start with loading the dataset into R that I’ll be working on. For simplicity and ease in explanation, I will be using an in-built dataset of R called “ChickWeight”. It gives information about the weight of chicks categorized according to their diet and the time since their birth.
# data set for chi square test (chi square in R example)
> data(ChickWeight)
I will first be conducting the test to check if the Diet and weight of a chick are independent of each other. The “chisq.test()” function is an in-built function of R that allows you to do this. It neatly tells you all you need to know about the independence of variables in a dataset to conclude whether they are related or not.
The arguments of the “chisq.test()” function can either be a data frame that clearly defines the count of the occurrences of the variables in each category, or two vectors that can be compared.
# chisq r - 2 by 2 table chi square test in r
> chisq.test(ChickWeight$Diet, ChickWeight$weight)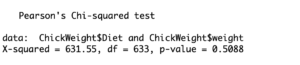
The test shows that the “p” value is above 0.05 and therefore, the weight of the chick does not depend on the diet. Although this may seem odd at first because each chick’s weight should depend on what the chick eats. However, it may not be true in this context. If every chick receives the same nutrition, or sufficient nutrition regardless of its diet, then diet shouldn’t play a significant role in the weight of one chick being different from another chick.
Now, we can test for weight against another variable, time for instance. This variable estimates the time since the chick hatched.
# chi square test in r code
> chisq.test(ChickWeight$Time, ChickWeight$weight)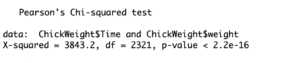
[Here you can see a very small “p” value, which suggests that there is a strong relationship between the weight of the chick and the amount of time since the chick hatched. Now this was pretty much of an intuitive answer because a chick gains weight as it grows older. However, the reason I conducted this test was to show you how the chi square test estimates relationships between categorical variables.
Applications and Uses of the Chi Square Test?
Now that you know what the chi square test is, you may be wondering how you can use it to obtain tangible information and when it can be of use to you. Here are some practical applications of the chi square test.
Medicine and Diagnosis
Medical statisticians may use the chi square test on a data that lists patients of a specific disease and against treatments or diets they received. A very simple example can be found using an in-built dataset of R, “Arthritis”. It compares the improvement in patients’ health against the type of treatment they received.
You can load the dataset after you have loaded the following relevant libraries. Your code should look this this.
# pearson's chi squared test in r
> library(grid)
> library(vcd)
> data(Arthritis)
> chisq.test(Arthritis$Treatment, Arthritis$Improved)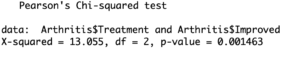
Pearson’s Chi Squared test in R
Social Experiments
A number of social scientists spend a large part of their time collecting data and analyzing it to study human behavior or consumer trends etc. These scientists mostly collect categorical data in nominal terms which is precisely what the chi square test runs on.
A statistician once proved that uniform color had a strong relationship with the number of fatalities of workers in specific job roles. This immediately led to developments in construction site safety which substantially improved worker safety.
Business Statistics
Businesses are often interested in knowing whether they do better or worse given certain conditions, or they may collect consumer data to study patterns and make conclusions.
The chi square test is widely used in business statistics and even more widely in financial statistics where professionals work with nominal data. This is one of the many tests in R you can use to assess the statistical validity of an insight.
The chi square test is a very important statistical tool that comes in handy a little too often when statisticians are working to find meaningful correlations in observed data. If you’re headed into data science, then conducting this test is one of those skills that you will be using over and over to the very end.
Going Deeper…
Interested in Learning More About Categorical Data Analysis in R? Check Out:
- How to Plot Categorical Data in R
- How To Create a Contingency Table in R
- How To Generate Descriptive Statistics in R
- How To Create a Histogram in R
The Author:
Syed Abdul Hadi is an aspiring undergrad with a keen interest in data analytics using mathematical models and data processing software. His expertise lies in predictive analysis and interactive visualization techniques. Reading, travelling and horse back riding are among his downtime activities. Visit him on LinkedIn for updates on his work.