We’re going to walk through how to add and delete rows to a data frame using R.
This article continues the examples started in our data frame tutorial. We’re using the ChickWeight data frame example which is included in the standard R distribution. You can easily get to this by typing: data(ChickWeight) in the R console. This data frame captures the weight of chickens that were fed different diets over a period of 21 days. If you can imagine someone walking around a research farm with a clipboard for an agricultural experiment, you’ve got the right idea….
This series has a couple of parts – feel free to skip ahead to the most relevant parts.
- Inspecting your data
- Ways to Select a Subset of Data From an R Data Frame
- How To Create an R Data Frame
- How To Sort an R Data Frame
- How to Add and Remove Columns
- Renaming Columns
- How To Add and Remove Rows
- How to Merge Two Data Frames
So we’ve shown you how to create and perform basic manipulations on a data frame object using R, including adding and removing data columns and calculated fields. For the next step in our tutorial, we’re going to talk about adding and removing rows. We cover a number of examples below, with sample code for each.
How to Remove A Row in R (Single, Specific Row)
There is a simple option to drop row(s) from a data frame – we can identify them by number. Continuing our example below, suppose we wished to purge row 578 (day 21 for chick 50) to address a data integrity problem. We could code this as follows:
# how to remove specific rows in r
# remove rows in r by row number
test <- ChickWeight[-c(578),]
Yielding the following result.
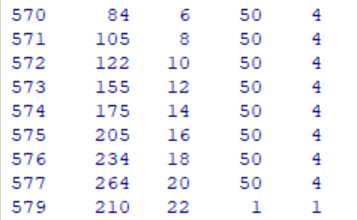
Where, as you can see, we have surgically removed observation 578 from the sample.
How to Remove Rows in R (Multiple Rows)
For larger data removals, it is generally easier to use the methods recommended for selecting a subset. This allows you to set up rules for deleting rows based on specific criteria. For an R code example, see the item below.
# remove rows in r - subset function with multiple conditions
subset(ChickWeight, Diet==4 && Time == 21)
We are able to use the subset command to delete rows that don’t meet specific conditions. Note that you can write very intricate conditions to delete row(s) using this approach, looking at multiple columns to control the delete statement.
Using subset() Function in R to Select and Remove Rows Based on a Condition
The subset() function in R is a powerful and flexible tool for selecting rows from a dataset based on specific conditions. It is particularly useful for data manipulation and cleaning tasks. In this short passage, we will demonstrate how to use the subset() function to select rows that meet a certain condition, and then remove them from the dataset using the - operator. The condition can be any number of things – a numerical comparison, a logical test, matching a specific string…
The subset() function has the following syntax:
subset(x, subset, select, drop = FALSE)Where:
x: The dataset you want to filter.subset: The condition you want to apply for filtering the rows.select: The columns you want to keep in the result (optional).drop: A logical value, indicating whether to drop or not the dimensions that have only one level after subsetting (default isFALSE).
Here is a sample code demonstrating the use of subset() to select and remove rows based on a condition:
#create a data frame
df <- data.frame(
  id = 1:10,
  age = c(25, 30, 18, 45, 22, 38, 29, 33, 21, 27),
  gender = c("M", "F", "F", "M", "F", "M", "M", "F", "F", "M")
)

# select rows where age is greater than or equal to 30 and gender is not equal "M"
subset_df <- subset(df, age >= 30 & gender!="M")

# print the final data frame
print(subset_df)

  id age gender
2  2  30      F
8  8  33      F
In this example, we defined an arbitrary data frame and filtered out rows that with an age over 30 or a gender = “M”. Here’s a step-by-step explanation of the code:
- We defined our dataset using the data.frame() function
- We used the subset() function to select all rows meeting two specific conditions (age over 30, not male)
- We print the resulting data frame
In summary, the subset() function in R provides a convenient way to select and remove rows from a dataset based on specific conditions. By combining it with the - operator, you can effectively filter your datasets and perform data manipulation tasks with ease.
A More Abstract example of using subset() remove rows in R data frames
If you’re working on a more complicated data hygiene project, for example, cleaning up and normalizing multiple data sets from similar sources, you can approach these tasks a bit more abstractly. For example, you can pass the select statement to the subset() function as a variable. This is helpful if you want to adjust what you are filtering based on a prior analysis – for example, dropping any record more than three standard deviations outside the range of the dataset (or a more complex rubric left to the developer’s imagination). You can also drop row(s) using indexes vs. directly removing them from a dataset, which allows you to further abstract your operations and pass a list through multiple criteria if you desire. Then use the row index to remove the corresponding row using the – operator, keeping the remaining row(s). We cover this in the code sample below.
In this code example, we’re adjusting the previous program to accept a parameter from an (imaginary) website form (perhaps Shiny?). This is passed to your analytical scripts as variable, after which we run the example above. We’re also setting this example up to filter out (vs. select) records based the criteria.
# create a data frame
df <- data.frame(
  id = 1:10,
  age = c(25, 30, 18, 45, 22, 38, 29, 33, 21, 27),
  gender = c("M", "F", "F", "M", "F", "M", "M", "F", "F", "M")
)

age_cutoff_entered_from_shiny_webform = 25

condition <- df$age < age_cutoff_entered_from_shiny_webform

# Use subset() to select rows that meet the condition
rows_to_remove <- subset(df, subset = condition)

# Remove rows from the dataset using the - operator
subset_df <- df[-which(condition), ]

# print the final data frame
print(subset_df)
This example will drop any record below the age of 25, yielding the following result:
   id age gender
1   1  25      M
2   2  30      F
4   4  45      M
6   6  38      M
7   7  29      M
8   8  33      F
10 10  27      M
Using the filter() function from the dplyr Package
The dplyr package provides a powerful set of tools for working with data frames in R. One of the most commonly used functions in this package is filter(), which allows you to select rows from a data frame based on a condition. You can then use the - operator to remove these rows from the data frame.
Here’s an example code snippet that demonstrates this process:
# load the dplyr package
library(dplyr)

# create a data frame
df <- data.frame(
  id = 1:10,
  age = c(25, 30, 18, 45, 22, 38, 29, 33, 21, 27),
  gender = c("M", "F", "F", "M", "F", "M", "M", "F", "F", "M")
)

# use filter() to select rows where age is greater than or equal to 30
filtered_df <- filter(df, age >= 30)

# use the - operator to remove rows where gender is "M"
final_df <- filtered_df[-which(filtered_df$gender == "M"), ]

# print the final data frame
print(final_df)
In this R code example, we first load the dplyr package, which provides the filter() function for selecting rows based on a condition. We then create a data frame with 10 rows and 3 columns (id, age, and gender).
Next, we use the filter() function to select rows where the age column is greater than or equal to 30. This creates a new data frame called filtered_df.
Finally, we use the - operator to remove rows where the gender column is “M” from filtered_df. We do this by first using the which() function to find the indices of the rows where gender is “M”, and then using the - operator to remove those rows from filtered_df. This creates a final data frame called final_df.
Finally, we print the final_df data frame to the console. The output should be a data frame with 3 rows (corresponding to the three rows where age is greater than or equal to 30 and gender is not “M”).
How to Remove Empty Rows in R
A common condition for deleting blank rows in r is Null or NA values which indicate the entire row is effectively an empty row. There are actually several ways to accomplish this – we have an entire article here.
For the sake of this article, we’re going to focus on one: omit. The omit function can be used to quickly drop rows with missing data. Here is an example of using the na omit function to clean up your dataframe.
# remove rows in r - drop missing values
> test
  breaks wool tension
1     26    A       L
2     30    A       L
3     54    A       L
4     25    A       L
5     70    A       L
6     52    A       L
7     NA <NA>    <NA>

new test <- na.omit(test)

> test
  breaks wool tension
1     26    A       L
2     30    A       L
3     54    A       L
4     25    A       L
5     70    A       L
6     52    A       L
Note: if you are only trying to eliminate rows where some but not all of the columns have a blank cell, consider using the prior remove row method. You can set up a filter so a selected row has no null value items in the specific column names you want. This approach is also good for managing data type conversion issues, so you have a clean dataset to work with.
How to Remove Duplicate Records In R
Real world data collection isn’t always pretty; data logs are usually built for the convenience of the logger, not the analyst. You will frequently need to remove duplicate values or duplicate rows from an operational data source for a clean analysis. Fortunately there is a core R function you can use to get the unique value rows within a data frame.
First, delete columns which aren’t relevant to the analysis; next, feed this data frame into the unique function to get the unique rows in the data. This will remove duplicate row entries and give you a clean set of unique rows. Watch out for missing value observations, since they will affect the process of detecting a duplicated row.
We’ve got another article on how to use the unique function to remove duplicated rows, with more examples of how to deal with duplicate data.
How to Add a New Row in R
For the first R code example, we will show you add a row to a dataframe in r. For example, let us suppose we collected one final measurement – day 22 – for our chicken weight data set. We would naturally want to add this into our data frame. Along the same lines, we might also be “healing” a missing data point by adding a record to fill the gap with an appropriate value (real or interpolated). In either event, we would use two R functions to make this work:
- data.frame() – to create a data frame object holding the rows we want to append
- rbind() – which is used to append two data frames to each other
Our code for this would look like the following:
# add row to dataframe r
newRow <- data.frame(weight='210',Time='22',Chick='1',Diet='1')
ChickWeight <- rbind(ChickWeight, newRow)
We hit submit and see the following….
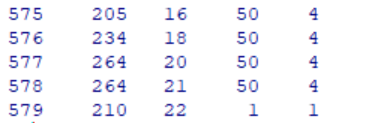
Indicating the process was successful. As you can see, we have inserted a row into the R dataframe immediately following the existing rows. We now have a weight value of 210 inserted for an imaginary 22nd measurement day for the first chick, who was fed diet one.
How to Add Rows To A Dataframe (Multiple)
If we needed to insert multiple rows into a r data frame, we have several options.
First, we can write a loop to append rows to a data frame. This is good if we are doing something like web scraping, where we want to add rows to the data frame after we download each page. We can still use this basic mechanism within a loop, iterating our results and adding new rows to the data frame. And that covers how to add a row to a dataframe in R.
# adding rows - r append to dataframe in loop
# assume scrape_data and parse_page are custom functions

for (url in urlList){
   # scrape the website urls and parse the results
   webpage <- scrape_data (url)
   newRow <-parse_page (webpage)

   # add row to dataframe r
   results <- rbind(results, newRow)
}
You also have the option of using rbind to add multiple rows at once – or even combine two R data frames. If you want to add rows this way, the two data frames need to have the same number of columns.
# add row to dataframe r / adding rows

combined <- rbind(initial, extra)
Add Empty Row to Dataframe
It is generally considered good form to initialize variables before you use them in data science projects. This makes it easier for others to interpret. This may be advisable if you have to perform complex calculations to add a new row to the data frame. In this case, we will create an empty row that you can populate at a later date.
We accomplish this by taking your existing dataframe and adding a row, setting the values of this row to NA.
# add empty row to dataframe r

> test
  breaks wool tension
1     26    A       L
2     30    A       L
3     54    A       L
4     25    A       L
5     70    A       L
6     52    A       L

> test[nrow(test)+1,] <- NA
> test
  breaks wool tension
1     26    A       L
2     30    A       L
3     54    A       L
4     25    A       L
5     70    A       L
6     52    A       L
7     NA <NA>    <NA>
If you are looking to create an empty data frame, check out this article.
Next up – how to merge two R data frames. Or if you want to skip ahead….