We’re going to walk through how to create a dataframe in R, a special type of data structure that can be used for almost any R programming function, and is available in base R without having to installl the dplyr package or any different type of package. This R tutorial will show you how to create this incredible data object, which has similar functionality to a matrix but is an even more versatile data structure.
This article continues the examples started in our data frame tutorial. We’re using the ChickWeight data frame example which is included in the standard R distribution. You can easily get to this by typing: data(ChickWeight) in the R console. This data frame captures the weight of chickens that were fed different diets over a period of 21 days. If you can imagine someone walking around a research farm with a clipboard for an agricultural experiment, you’ve got the right idea….
This series has a couple of parts – feel free to skip ahead to the most relevant parts.
- Inspecting your data
- Ways to Select a Subset of Data From an R Data Frame
- How To Create an R Data Frame
- How To Sort an R Data Frame
- How to Add and Remove Columns
- Renaming Columns
- How To Add and Remove Rows
- How to Merge Two Data Frames
Creating Your Own Data Frames
Continuing the example in our r data frame tutorial, we have three attributes in the original example that we might be able to enrich with a little additional data. In addition to their weight, we know three things about the chicken measurements.
- Their Diet – 4 possible factors – perhaps we can group the diets further
- The Chick # – There are 50 chickens, perhaps they have something in common such as breed or parents
- Time – date of measurement, perhaps there were things going on that we can use to segment the data
Lets start by creating a data frame in R to expand on what we know about the diet.
How to Create a Dataframe in R
A R data frame is composed of “vectors”, an R data type that represents an ordered list of values. A vector can come in several forms, from a numeric to character vector, or a column vector, which is often used in an R data frame to help organize each data object. Each column vector can be equal length, or you could have a data frame in which the second column is a different size than the first, depending on what kind of new variable you plan on introducing to your data frame. In this R tutorial, we will use a character vector to show the diet. In the case of the diet, we know there are several nutrients inside each of the 4 diet variations the chickens were fed.
- Protein – High or Low
- Vitamin – High or Low
So we fed the chickens combinations of each to understand the effects of each element. We create this by setting up a series of vectors to represent this experiment.
# how to create a dataframe in r
diets <- data.frame ('diet'=1:4, 'protein'=c(0,0,1,1), 'vitamin'=c(0,1,0,1))
The results of this effort looks like:
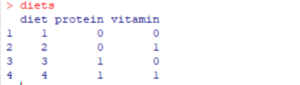
This now exists in a data frame titled “diets” which we can join (at some future point) with our original data frame to enrich our data with additional attributes about each diet.
Pro-tip: It’s worth taking the extra time to set up column names which are easily readable. Many R code scripts tend to “grow” over time, as you run additional studies on a dataset, remap value(s) into a categorical variable, or add a new column. You’ll generally spend a lot more time reading your old R code than creating new R code. Keeping column names easily comprehensible pays dividends in the long run. The same goes for any data set element you use for row names (or another row index value). Avoid duplicated column names within a data frame for similar reasons. You can often build off what is in an existing data frame.
Practical Examples
The ability to create a dataframe in R from within your code is particularly useful in business analytics.
First, while in many cases you will be importing data from Excel (or csv file) or SQL database, you may decide to insert additional attributes you identify over the course of your research. For example, by digging around a bit in the chicken farming example, we identified that there was a mix of factors behind each diet. Further statistical analysis could identify that diets with certain components perform better than others – which could be important to future testing. Along the same lines, you might identify that certain data points are questionable (the night inspector was frequently sleeping, for example) and should be dismissed from the analysis.
Another good reason to create a new data frame is when you have to make major changes for a missing value. Missing value situations affect your code at two levels. First, these will break many function or r package settings. Second, the absence of data (missing value) often has predictive power in real world analysis (especially for things like fraud detection & process failures). The data manipulation gets even more complicated if you’re trying to clean up multiple columns, since you’re effectively subsetting your data frame for complete and accurate data.
The other opportunity here is the ability to run “what-if” scenarios within your analysis. For example, you may want to be able to adjust certain factors in an optimization script (more/less cost, more/less sensitivity, tighter constraints) as part of your analysis. Creating an R dataframe from your script and merging it with other data is an excellent way to make these sorts of dynamic adjustments.
Now that we’ve shown you how to create a dataframe in R….
Up next…sorting R data frames. Or if you want to skip ahead, see below….