I was recently asked by a client to create a large number of “proof of concept” visualizations that illustrated the power of R for compiling and analyzing disparate datasets. The client was specifically interested in automated analyses of global data. A little research led me to the WDI package.
The WDI package is a tool to “search, extract and format data from the World Bank’s World Development Indicators” (WDI help). In essence, it is an R-based wrapper for the World Bank Economic Indicators Data API. When used in combination with the information on the World Bank data portal it provides easy access to thousands of global datapoints.
Here is an example use case that illustrates how simple and easy it is to use, especially with a little help from the countrycode and ggplot2 packages:
# wdi r - world bank data api
library(WDI)
# countrycode r - world bank country code
library(countrycode)
library(ggplot2)

# Use the WDIsearch function to get a list of fertility rate indicators
indicatorMetaData <- WDIsearch("Fertility rate", field="name", short=FALSE)

# Define a list of countries for which to pull data
countries <- c("United States", "Britain", "Sweden", "Germany")

# Convert the country names to iso2c format used in the World Bank data
iso2cNames <- countrycode(countries, "country.name", "iso2c")

# Pull data for each countries for the first two fertility rate indicators, for the years 2001 to 2011
wdiData <- WDI(iso2cNames, indicatorMetaData[1:2,1], start=2001, end=2011)

# Pull out indicator names
indicatorNames <- indicatorMetaData[1:2, 1]

# Create trend charts for the first two indicators
for (indicatorName in indicatorNames) {
pl <- ggplot(wdiData, aes(x=year, y=wdiData[,indicatorName], group=country, color=country))+
geom_line(size=1)+
scale_x_continuous(name="Year", breaks=c(unique(wdiData[,"year"])))+
scale_y_continuous(name=indicatorName)+
scale_linetype_discrete(name="Country")+
theme(legend.title=element_blank())+
ggtitle(paste(indicatorMetaData[indicatorMetaData[,1]==indicatorName, "name"], "\n"))
ggsave(paste(indicatorName, ".jpg", sep=""), pl)
}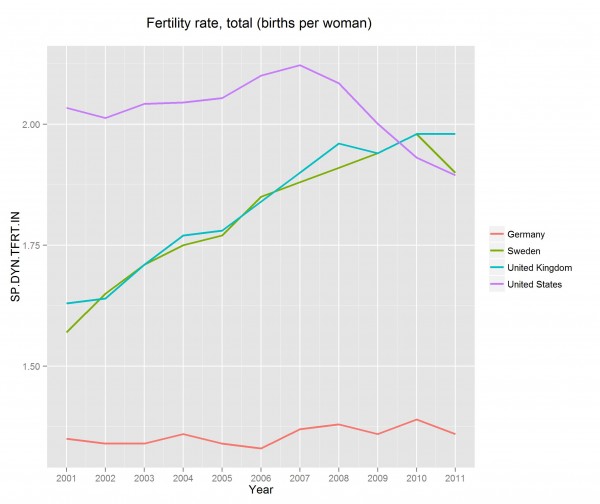
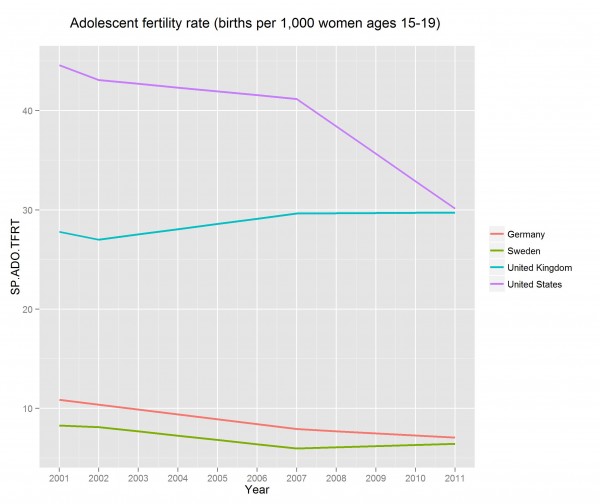
This code can be adapted to quickly pull and visualize many pieces of data. Even if you don’t have an analytic need for the WDI data, the ease of access and depth of information available via the WDI package make them perfect for creating toy examples for classes, presentations or blogs, or conveying the power and depth of available R packages.
This article was one of several this blog has done on graphics and visualization; you may also be interested in:
- Introduction to building animated graphs using R
- Tricks for Plotting multiple graphs on the same panel
- Fancy Formatting for margins and axes
Other related topics:
- Web Scraping when data isn’t available via an API wrapper:
- RCurl (simple)
- Rvest (CSS selector targeting)
- JSON based scraping (AJAX sites, API’s)