A contingency table is something that statisticians often use to determine a relationship between two or more categorical variables. What’s important in a contingency table is that it presents the frequency count, or in layman terms, the occurrences of a variable in a convenient manner. This can work with a categorical variable because it is only counting the odds ratio and marginal totals of occurrences of the categorical variable, and can do any calculations like a chi square test that you may see with a data frame instead of a flat contingency table.
In this tutorial, I will be explaining how to generate a contingency table in R and what you can do with it.
The Purpose and Uses of a Contingency Table
Imagine yourself in a position where you want to determine a relationship between two variables. As a first step you would want to see the frequency count of each variable against a condition. You may be able to crunch the numbers for a small data set on paper, but when working with larger data, you need more sophisticated tools and a contingency table is one of them. When working with big data, as statisticians normally do, a contingency table condenses a large number of observations and neatly displays them in a table that makes readability and further calculations particularly easier. Tests with a null hypothesis such as the Chi Square test and Fisher’s Exact test can be conducted with a breeze if you have a flat contingency table for the data set instead of a data frame. You can find conditional probability, relative frequency, expected value, the chi squared statistic, and other similar statistic measures from the character vector contingency table object. This is easier than trying to perform those calculations with a different R object such as a data frame that has a different column variable set up.
Understanding a Contingency Table
I’ll begin by showing you a contingency table. In this tutorial, I’ll be using a built-in data set of R, “infert” for its structural simplicity. It shows data of infertility among women with the education they received (in years) against their number of induced abortions. This flat matrix form data is made up of a character string of different values, with marginal distribution that allows us to create a 2×2 contingency table or larger to calculate all sorts of different factor statistics, including the chi square statistic, the phi coefficient, conditional independence, column percentage, and others that we can put in a flat table or bar chart.
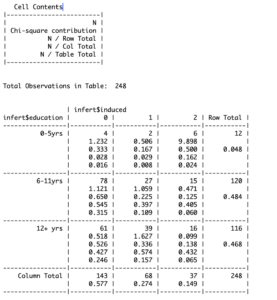
Understanding what the values in this table function mean requires me to take you into the details of how a contingency table is actually generated. The rows represent the years of education the women have received whereas the columns show the number of induced abortions they had. The information you need to determine a relationship between these two variables can be found in the cells of the table.
In the first cell for instance, N (i.e. 4) shows the proportion of women from a total of 248 who received 0-5 years of education and had no abortions. Apart from this proportion, you can see additional information in each cell. Again, for the first cell, the ratio of N and row total is the proportion of women who got no abortion given that they received 0-5 years of education. The ratio of N and column total, convertibly, shows the proportion of women who received 0-5 years of education given that they got no abortions. Finally, the ratio of N and table total shows the expected number of abortions for a given education and number of abortions for a woman. It gets easier to draw a relationship between two or more variables when you are able to see things in probabilistic terms.
Now that you know what the information in a contingency table means, I’ll proceed to show how you can generate a contingency table in R.
Generating a Contingency Table in R
As said earlier, I’ll be working on “infert” in this tutorial, so we’ll first start with loading the dataset in R.
# R contingency table labels
> data("infert")
Once loaded, you can start working on it. First off, we’ll generate a basic contingency table that shows a frequency count. You can do that using the “with” command in R.
# create contingency table r
> with(infert, table(education, induced))
Alternatively, you can get the same result using the “xtabs” function.
# how to make a contingency table
> xtabs(~education + induced, data= infert) 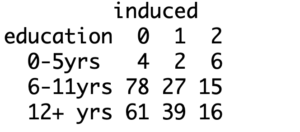
This is a basic contingency table that organizes data in a two-way format, it helps visualize proportions but not the expected values as you could see earlier. Fortunately, getting to that isn’t much difficult with R.
In order to get a more detailed contingency table, you can use the “gmodels” package. If you haven’t installed it already, you can do that using the install.packages command. Your code should look like this.
# create a frequency table in R
> install.packages("gmodels")
> library(gmodels)
> with(infert, CrossTable(education, induced))
Other Ways of Getting a Contingency Table in R
Now that you know how to create a contingency table in R, we can look at other ways of doing it quickly and how you can get creative with them.
First off, let’s try to build on what you already know. Generating a contingency table in R studio or base R using the “gmodels” package gives you information like row total, column total and the expected values. But you may have noticed that generating it using the “xtabs” function does not give you such information. Moreover, it also does not give you any information about the distribution of the variables.
R, however, lets you conveniently obtain such information in a number of ways. The “rowsum” and “colsum” functions are one way to go about it. You can read about these functions here.
Another convenient method of obtaining a contingency table is with the use of the “prop.table” function. It gives you the joint distribution of variables and you can use the “addmargins” command to see a row and column total as well.
# how to make frequency table in r
> prop.table(addmargins(xtabs(~education + induced, data=infert)))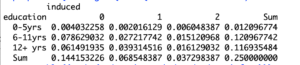
Moreover, you may also have noticed that we have only looked at contingency tables with two variables as of yet, how do you handle a greater number of variables?
This is an important question because statisticians often need to determine a relationship with three or even more variables. This is where you can’t use that nicely labelled “gmodels” package, but the “xtabs” function comes in handy. It can help you handle any number of variables.
Suppose you also want to see the frequency count of spontaneous abortions alongside education and induced abortions. You can do that by adding additional parameters in “xtabs”. The R “ftable” function allows you to visualize the data in a more organized manner. This will help you count frequency in R, and create an expected frequency contingency table for even more statistical applications.
# create contingency table in R
> three.table=  xtabs(~education + induced + spontaneous, data = infert)
> ftable(three.table)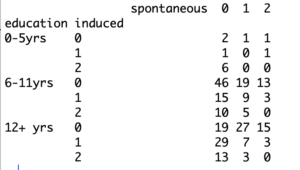
Finally, as said earlier, a contingency table sets up a canvas for you to conduct further statistical tests on the data to determine relationships and study the behavior of variables. You can create a contingency table with percentages in R, learn how to solve contingency table problems, or even do a contingency table of categorical data. There are also a number of functions and tests you can do with contingency tables in R. The Chi-Square test for instance, lets you calculate how close an expected data (hypothesis is to the observed data.
Going Deeper…
Interested in Learning More About Categorical Data Analysis in R? Check Out
Graphics
Tutorials
- How To Create a Frequency Table in R
- How To Generate Descriptive Statistics in R
- How To Create a Histogram in R
- How To Create a Side-By-Side Boxplot in R
- How To Load Existing Data in R
The Author:
Syed Abdul Hadi is an aspiring undergrad with a keen interest in data analytics using mathematical models and data processing software. His expertise lies in predictive analysis and interactive visualization techniques. Reading, travelling and horse back riding are among his downtime activities. Visit him on LinkedIn for updates on his work.