Given a numerical data frame of students’ grades in a class, you may be given the task of finding information like what is the relative position of a particular student in the final exam. Or you may also have to find out what percentage of the class failed a particular component of the course.
You can use R to find the Z-Score for a given P value using the qnorm() function.
Statistical parameters such as the p value and the zscore, also called the standard score, are largely used to make such calculations. While a statistic class sometimes teaches you how to do this on paper, it is important to be able to do this quickly. R gives you a number of functions that you can use to make such calculations for a large data frame fairly quickly.
Before I dive into the coding and the methodology of how you can find the standard score for a p value in R, I’ll explain what exactly these terms mean and why you need them.
What is a P-Value?
A p-value falls between 0 and 1 just like the likelihood of an event happening, it gives the probability of a null hypothesis being valid. A null hypothesis is a statement that suggests that there is no correlation coefficient between the two variables, it opposes the hypothesis that the two variables are correlated.
As a norm, whenever a p value of less than or equal to 0.05 is found, we say that the two variables are correlated, in other words, the probability of the null hypothesis being invalid is insignificantly low. Moreover, any p-value higher than 0.05 suggests that the variables are not related in any manner.
You can read more about p-values and how to find them with contingency tables here.
What is a Z-Score?
Suppose you have the distribution of class grades for an exam that appears to be normal and it has a mean of 45. Now suppose the instructor is interested in knowing whether one of his best students who scored a 75 is among the top 10% of the scorers. In the beginning, this may seem like a tedious calculation, but the zscore test statistic makes it fairly easy. Using the given information, the instructor can find the standard score using the z score calculation formula. This turns your raw score into a standardized score (which can be used to calculate tail probabilities for hypothesis testing).
Z= (value – mean)/ (Standard Deviation)
Using a z table, you can obtain the corresponding p value test statistic for this z score, and the p value here should tell you what the chances are for someone in the class to score more than 75 marks in terms of probability. In other words, it should tell the instructor whether a score of 75 is in the top 10% of the class or not.
In more simple terminology, the standard score tells you how far an observation is from the average of the data in terms of standard deviations. A z score of 1 tells you that the observation is at a distance of one standard deviation towards the right from the center. Similarly, a z score of -1 tells you that the observation is one standard deviation towards the left of the center. Alternatively, a z table gives you a p value corresponding to this z score, it tells you what percentage of observations lie above and below this point in that sampling distribution. Z score standardization allows you to take each population standard deviation and mean, assuming they follow a normal curve, and calculate the z score for each, so that you can compare more than one independent variable with a different sample size to another in a standard normal distribution, even though the original scores may be on a different scale.
Now all this may seem like a lot of statistical analysis, but R allows you to conveniently do this with a few lines of code. I’ll now proceed to show you how.
Finding a Z Score in R
Suppose you have been given a p value; this would be the percentage of observations that lie towards the left of the value that it corresponds to within the cumulative distribution function. If, for example, your p value is 0.80, it would be the point below which 80% of the observations lie, and above it, 20%.
Remember that I said you can find out a corresponding p value for a z value using the z table. In order to go the other way around, i.e., find a z value for a given p value, you can always use the z table again and find the corresponding z score.
However, R makes this simpler for you. Probably the easiest way to find a z score for a given p value is through the use of the “qnorm()” function. It takes an argument of the p value and gives the z score. Moreover, the function is used for a range of purposes, if you are interested in pursuing data science, I encourage you to read the documentation on the “qnorm()” function as well.
# qnorm in r - function to calculate z score in r
> qnorm(0.75)
[1] 0.6744898
The output of the function is the z score. Its value being below 1 means that the point that separates the lower 75% observations and upper 25% observations is within one standard deviation of the average, towards the right.
Conducting a Normality Test
A normality test tells you whether the probability distribution of your data is normal, and if so, to what extent it is normal. In simpler words, it measures the significance of the normality of your data. This is important because most of the tests that statisticians often conduct on data require that the data follows a standard normal distribution.
At this point, it may be important to bring light to the central limit theorem which essentially says that if a data contains a sufficiently high number of observations, the distribution will be normal. However, a normality test systematically measures how normal your data is and therefore, it is necessary.
I’ll be using an in-built dataset of R called “ToothGrowth”, that shows data of the length of teeth of guinea pigs categorized according to the vitamins and dosage they were given.
The most commonly used test for normality is the Shapiro-Wilk’s test. I will plug in the column that contains the length of teeth for the pigs into to function.
# z critical value in r - testing for normality
> shapiro.test(ToothGrowth$len)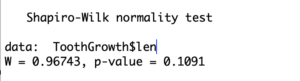
In this case, the p value is much greater than 0.05 giving the null hypothesis sufficient probability. Therefore, the data does not follow a strong normal distribution. You can verify the results by plotting the data yourself as well.
# z score tutorial; checking for normality part II
> ggdensity(ToothGrowth$len, main = "Normality", xlab = "Tooth length")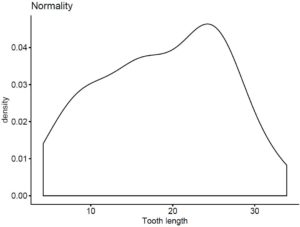
Going Deeper…
Interested in Learning More About Statistical Testing in R? Check Out:
The Author:
Syed Abdul Hadi is an aspiring undergrad with a keen interest in data analytics using mathematical models and data processing software. His expertise lies in predictive analysis and interactive visualization techniques. Reading, travelling and horse back riding are among his downtime activities. Visit him on LinkedIn for updates on his work.