Learning how to load data in R is easy! Our tutorial starts with the basic task of loading information from a text file into the R environment. For those of you who are new to a corporate environment, Excel spreadsheets are the backbone of most Finance and Operations departments, providing business users with a convenient way to collect, edit, and present information. The contents of an Excel spreadsheet can be easily exported into a file format known as CSV (Comma Separated Values) which can then be loaded into R.
Picture This…
To make this tutorial more interesting, imagine that we have just been hired as analysts on the marketing team for a small manufacturer. Our job is to take information about the company’s products and customers (from management and the company’s information systems) and distill it into useful reports and charts for business managers.
In this particular case, we have been handed a file of information about the company’s sales over the past week. It is in the form of an Excel spreadsheet downloaded from the accounts receivable system, containing the following fields:
- invoice number
- customer id
- product id
- delivery date
- sale amount
The general manager of the business would like us to summarize this data to understand which customers and products are most active. Naturally, we would like to use R for this analysis and thus we need to load the file into R. We use Excel’s “save as” command to save the file in Comma Separated Value format (CSV) and get started.
Loading The File
Let’s learn how to load data in R. Since the first line of the file contains field names for each column, this is easily accomplished with the following single line of code:
# how to import file to r
mydataset <- read.csv("invoices.csv")
Incidentally, in the event the accounting system had not included a header row, we could have used the following command.
# r import csv file
mydataset <- read.csv("filename.csv", header=FALSE)
It is good form to inspect your data after you load it from a file into a new system; while the process we are using is considered reliable, conversion and formatting errors can occur and will cause problems for you during the analysis process. The R language includes several built in utilities for inspecting your data. The most basic of these is summary().
Creating A Summary
If we type:
# how to import a file in r
summary(mydataset)
It will provide you with something like this:
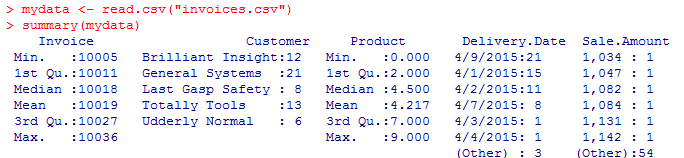
The summary function provides you with some default statistics for each column. If the data is a numerical variable, it will describe the results in the form of a statistical distribution – mean, median, min, max, and 1st / 3rd quartiles (25% and 75%). If the data is a date or string (company name, etc,) it will show several common values and provide a total count.
Troubleshooting
Inspecting the data, we actually DO notice a potential issue here – the sale amount, which should be processed as a numerical variable was instead loaded as a string due to saving the Excel currency format on the CSV. This will cause problems later. So we go back to the original Excel file, change the format of that column to “general” (use the Format Cells feature on the Toolbars) and resave it. We reload and see:
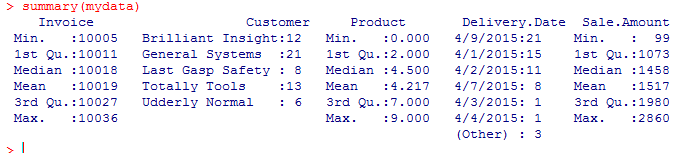
The sale is now expressed as a statistical distribution which is closer to what we expected. Mission Accomplished.
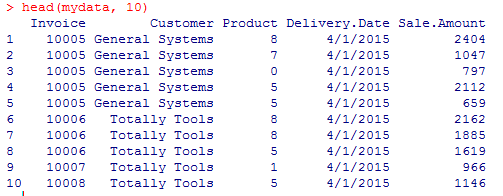
In the event we wanted to inspect a couple of individual lines of data, we could use the head command:
# how to load csv into r
head (mydata, 10)
Which yields the following result:
We hope this tutorial on how to load data in R was helpful, and encourage you to check out more of our site for all of your R programming needs!