The dplyr package comes with some very useful functions, and someone who uses R with data regularly would be able to appreciate the importance of this package. The group by function comes as a part of the dplyr package and it is used to group your data according to a specific element. A lot of literature that’s available on the group by in R dplyr function can be difficult to understand for someone who is new to programming on R. However, in this tutorial I have tried to explain the use of the group by function using very basic examples. This should hopefully give you a good grasp on what the group by function is used for.
I’ll begin by introducing ‘mtcars’, a built-in data set of R that we’ll be using throughout this tutorial. It holds information about the mileage, number of cylinders and many other characteristics of 32 cars.
> data(mtcars)
# loading the data set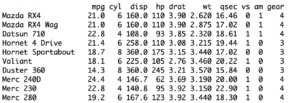
[We will use the fact that the cars in this data set have either 3, 4 or 5 gears and we can group our data according to the number of gears in the cars. This can be verified using the factor command.
# mtcars group by gear
> factor(mtcars$gear)
[1] 4 4 4 3 3 3 3 4 4 4 4 3 3 3 3 3 3 4 4 4 3 3 3 3 3 4 5 5 5 5 5
[32] 4
Levels: 3 4 5
In simple terminology, when I group the cars in my data according to their number of gears, I am able to answer questions like how many cars use 3 gears, what is the average mileage of cars that use 4 gears and how many different types of carburetors can be found in found in cars that use 4 gears etc. Answering all these questions should be a much simpler job if our data could be listed with all other features against the number of gears of the cars.
The group by function is followed by the infix operator (%>%) and it takes the column against which you want to group the data in its arguments. I’ll begin by loading the dplyr package and then using the group by function.
> library(dplyr)
> mtcars %>% group_by(gear)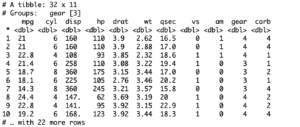
This will override the existing groups and create new ones, and we can use the group by function in R to group by any of the characteristics. We could to mtcars group by cyl, mtcars group by vsam, or mtcars group by gear as we did above.
The above table uses the same dimensions as our original data set and is in fact the same data set, only that it has been segregated into three groups, but this representation of the data set doesn’t tell you much. It is simply listing how it grouped the data, creating a nice little lazy data frame for us. But now that you can see what the group by function does, I can move on to more useful things you can do with this function.
Group by with Summarize
First, we’ll use the summarize function with group by to collapse all the data in accordance with the number of gears of the cars. The summarize function gives you a bigger picture of what is going on in your data.
> mtcars %>% group_by(gear) %>% summarize(n())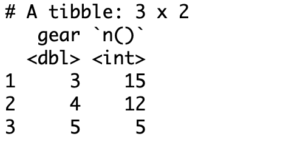
[This tells me that there are 15 cars that use 3 gears, 12 cars that use 4 gears and 5 cars that use 5 gears.
Now that you know what the summarize function is and how it works, let’s try to get something more useful out of it. I’ll be using the summarize function to find the average mileage per gallon of cars that have 3, 4 and 5 gears separately.
> mtcars %>% group_by(gear) %>% summarize(Avg_MPG = mean(mpg))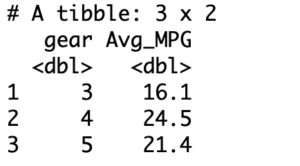
Once again, the same methods can be used for each aspect of the data, like group by cyl grouping.
[It is worth noting here that getting this information neatly displayed without the group by function would have required some extensive coding and would not have been the most efficient method. Moreover, one can imagine that if group wise statistics were needed for the number of carburetors, horsepower and all other columns, the task would get increasingly tedious. The group by function makes a programmer’s life much easier in many ways when the work involves extensive use of data.
Grouping by Multiple Columns
The group by function can also be used to group data according to more than one feature as well. In our data, we can see that the cars have either 1, 2 ,3, 4 ,6 or 8 carburetors. It does the same thing as with one feature, creating groups defined by variables instead of just one variable.
> factor (mtcars$carb)
 [1] 4 4 1 1 2 1 4 2 2 4 4 3 3 3 4 4 4 1 2 1 1 2 2 4 2 1 2 2 4 6 8 2
Levels: 1 2 3 4 6 8
Suppose you wanted to know the average mileage of all the cars that use 3 gears and 2 carburetors. The group by function can be used to help you with such information as well. This would require you to add additional columns (i.e., carb) when specifying the input data to the group by function. The implementation should look like this.
> mtcars %>% group_by(gear, carb) %>% summarize(Avg_MPG = mean(mpg))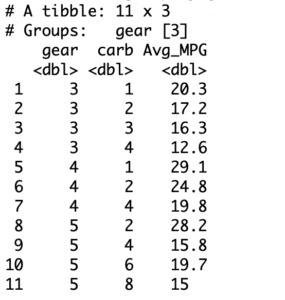
The group by function is a very essential part of the dplyr package and a necessity for someone who uses R to work with data. For tasks that involve data cleaning and categorical analysis of data, the group by function almost always comes into play. If you are headed into the field of data analytics, I strongly recommend that you practice with your own test data and read the R documentation on the group by function as well.
We hope this easy group by in R tutorial was helpful, and encourage you to check out some of our other helpful tips: