
Dataframes do not always come pre-formatted as we would like them. Consequently, it is often necessary to add additional columns of data to an existing dataframe. When this happens, R makes it very easy to execute. It even offers more than one way of formatting your data manipulation code.
Why Would You Add Columns?
Why would you need to know how to add a new column for data analysis in R? There are numerous reasons why you would add columns to an existing dataframe. The ability to add columns gives you the flexibility to format the data, that otherwise would not exist. Without this flexibility, the data format cannot adapt to different situations.
One reason to add column to a dataframe in r is to add data that you calculate based on the existing data set. Another reason would be to add supplementary data from another source. When embedding data in an article, you may also need to add row labels. These are just three examples of the many reasons you may want to add new column.
Adding and removing columns maximizes your flexibility on how you can use data. This feature allows you to adjust the existing data frame to any arrangement you want, providing almost unlimited flexibility and the way data is displayed.
How To Add A Column
There are three forms to this way of adding a new dataframe column to a data frame in r.
data-frame$column-name = vector
data-frame[["column-name"]] = vector
data-frame[,"column-name"] = vector
Each of these works the same, they are simply different ways of adding a new column to an existing data frame.
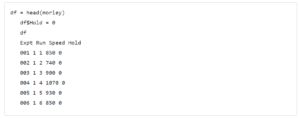
df = head(morley)
   df$Alph = c("a", "b", "c", "d", "e", "f")
   df
   Expt Run Speed Alph
   001 1 1 850 a
   002 1 2 740 b
   003 1 3 900 c
   004 1 4 1070 d
   005 1 5 930 e
   006 1 6 850 f
In this example, we simply added an alphabetic label to each row under the column name Alpha. In an actual chart, this approach could be used as a reference in the presentation of the data manipulation. Of course, there are many other uses, but this is a simple one.
Reorganizing Columns
Sometimes, a multiple column dataframe object does not come to you in the order you would like it, and the default value in the original dataframe may not work quite right for your data analysis. By saving the contents of an original dataframe column, you can delete the column first and then add it back to make it the last new dataframe column. This process can be repeated as often as necessary to obtain the desired sequence.
df = head(morley)
   X = df$Run
   df$Run = NULL
   df[["Run"]]= X
   df
   Expt Speed Run
   001 1 850 1
   002 1 740 2
   003 1 900 3
   004 1 1070 4
   005 1 930 5
   006 1 850 6
In this example, we are moving the second dataframe column value to the last position. First, we save its contents, and then delete the old columns. Next, we add it back in, thereby moving an existing column. Before re-adding the column headers, you are moving, you can do additional processing such as taking care of missing values.
Adding A Column Of Calculated Values.
One reason to add column to a dataframe object is to be able to include calculated values from existing data. This process makes it possible to display relationships that are not easy to see. This approach has more opportunities when you have multiple values in each row.
df = head(morley)
   x = df$Speed-mean(df$Speed)
   df[,"Deviation"]= x
   df
   Expt Run Speed Deviation
   001 1 1 850 -40
   002 1 2 740 -150
   003 1 3 900 10
   004 1 4 1070 180
   005 1 5 930 40
   006 1 6 850 -40
In this example, we have added a column value based on the deviation of each speed from the mean speed. This is a very straightforward calculation but it can be more complicated involving different columns as well as more than one add new column.
Adding A Placeholding Column.
A place holding column is a single column that is put in place so that values can be added later. If instead of equating your new column to a vector, you equate it to a single value that value will be duplicated across the entire column. This process is perfect for setting up a placeholder.
As you can see from this process effectively adds a new variable to the dataframe. This gives you a place to store additional values. The value that is entered can be any number, character, or string. It just needs to be the same data type you plan on putting in that place.
Using The cbind() Function.
This is a completely different way of adding columns to the data frame. Unlike the previous method, this method allows multiple columns to be added at the same time. This multiple column approach has the drawback of only using the vector names as the column names.
df = head(morley)
   Alph = c("a", "b", "c", "d", "e", "f")
   Deviation = df$Speed-mean(df$Speed)
   df = cbind(df, Deviation, Alph)
   df
   Expt Run Speed Deviation Alph
   001 1 1 850 -40 a
   002 1 2 740 -150 b
   003 1 3 900 10 c
   004 1 4 1070 180 d
   005 1 5 930 40 e
   006 1 6 850 -40 f
In this example, we have added two columns to the original data frame. Because the cbind() function also combines data frames, it makes it very easy to add new columns.
Adding columns to data frames is a simple process. Depending on how you handle it, this process can provide you with great flexibility in using a new data frame. Combining the approaches, we have used opens up a wide variety of options. These options will give you a lot of flexibility in your programming, even if there is a missing value, column label, or other default value or constant value issue with your new data frame column.
Check out these other great dataframe-related resources: