Collecting data can be a drudge for many tasks in economics or securities analysis. Fortunately, R has some good options available to streamline this task. Popular R Packages for Stock Data quantmod:The quantmod package is a favorite among financial analysts.It provides functions for quantitative financial modeling, including the retrieval of historical stock prices from sources […]
How to Remove Outliers in R
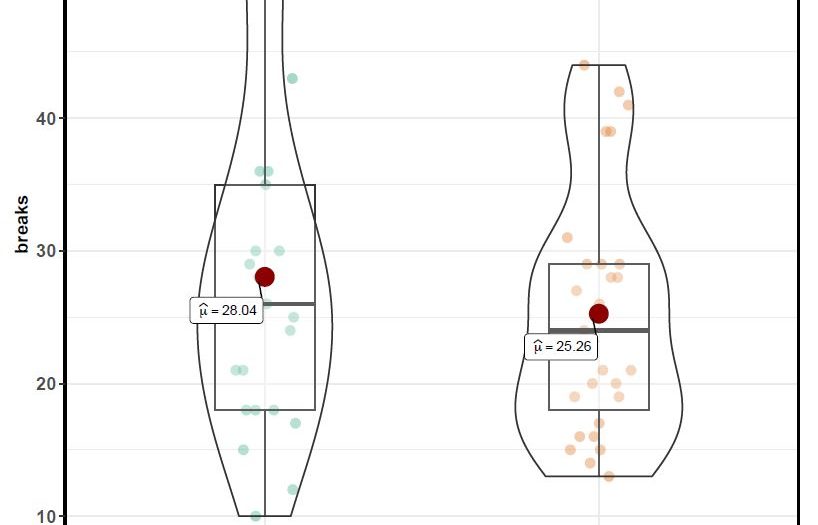
Statisticians often come across outliers when working with datasets and it is important to deal with them because of how significantly they can distort a statistical model. Your dataset may have values that are distinguishably different from most other values, these are referred to as outliers. Usually, an outlier is an anomaly that occurs due […]
Validate Me! Simple Test vs. Holdout Samples in R
In statistics, it is often necessary to not only model data but test that model as well. To do this, you need to randomly separate the data into two groups ensuring even samples regardless of the order of the original sample. Statistical model When a data scientist is working with a data set, he will […]
Zen and The Art of Competing Against MBA’s
“I appreciate your ambition, but we’re looking for an MBA…” My senior manager smiled and indicated the topic was closed. Despite the fact I was effectively running our direct mail program in the absence of my recently departed boss, the door was closed and locked. I quit two months later. Within three years, I was promoted […]

The First Date with your Data in R
So you have your data, now what? With a little R code, you can quickly get to know a lot about your dataset. By taking care of basic data hygiene, gathering summary statistics, and taking a quick look at your data through graphs first, your later analysis is strengthened and simplified. The graphs you produce […]

How To Make Your Data Analyst Resume Stand Out
To the typical reader, most technical resumes sound alike and share none of the unique personality behind the paper. For example, you may know that Jane is meticulous about data quality and has an amazing knack for creatively turning business requests into statistical problems. George is easily the most “flexible” person on your team when […]

Simple Anagram Finder Using R
One of my early programming projects in Python was a word game solver (example: word jumble solver or wordle solver) – the early version was a simple script, which grew into a web application. Since then, I’ve always enjoyed using dictionary search problems to test out a new language. Today’s article will look at building a searchable […]
Webscraping with rvest: So Easy Even An MBA Can Do It!
This is the fourth installment in our series about web scraping with R. This includes practical examples for the leading R web scraping packages, including: RCurl package and jsonlite (for JSON). This article primarily talks about using the rvest package. We will be targeting data using CSS tags. I read the email and my heart sank. As part […]
Resume & Interview Tips For R Programmers
Speaking as a hiring manager, it doesn’t take much to stand out as a candidate for a statistical programming job. We just finished hiring the last of several analyst positions for a new data science unit at my day job. The final round was surprisingly less competitive that I expected; many of the candidates either […]
Calling Python from R with rPython
Python has generated a good bit of buzz over the past year as an alternative to R. Personal biases aside, an expert makes the best use of the available tools, and sometimes Python is better suited to a task. As a case in point, I recently wanted to pull data via the Reddit API. There […]