A t test is used to determine if there is a significant correlation between the mean of two same or different groups. Statisticians use a t test for a purpose almost similar to that of a z test but with one major difference. While a t test is an effective tool when the sample data consists of less than 30 observations, a z test is used when there are more than 30 observations, i.e., for larger data sets. We’ll show you how to run a t test in R.
You can run a t test in R using the t.test() function in base R. This has options you can use to analyze one sample t tests, paired t tests, and two sample t tests.
Before I explain how you can conduct a t test using R, I will first explain why exactly it is needed and how it works.
Why Conduct a T Test?
Consider this, a research laboratory spent the last 5 years in the creation of a drug that extends the life expectancy of cancer patients. At the time of testing, there were two groups, the control group that was given a placebo (sugar pills) and the test group that was given the actual medication. After the test, the control group reported that their life expectancy increased by 6 years whereas that for the test group increased by 7 years. Any reasonable speculation could suggest that the new drug works great. However, this forfeits the possibility that the results could be that way because of mere luck. Statisticians refer to this as a chance agreement. A t test is needed to mathematically determine whether the results came out by chance or if there is an actual difference between the mean of the two groups.
How to Interpret the Results of a T Test?
When conducted on R, a t test gives you a t score and a p value in the results. In order to interpret the results of a t test, it is important to know what each of these output parameters mean.
T Score:
The t score is the difference of the averages of the two samples divided by the difference that appears within the two samples. In simpler terms, it gives you a measure of the difference of one sample from another relative to the differences within the sample itself. For example, a t score of 2 suggests that the samples are twice as different from each other relative to the differences that appear within them. The larger your t score gets, the more distinct the two groups are and there is a higher probability that the test results are not the result of a chance.
P Value:
This is the likelihood of falsely rejecting your null hypothesis. A null hypothesis is a simple statement that tells you that there isn’t a significant difference in the mean of the two samples being tested. This runs opposite to the alternative hypothesis that says that the two samples differ significantly in their mean.
Normally, whenever this value is less than 0.05, the null hypothesis has a significantly low probability of being false.
Types of T Tests
There are generally three different types of t tests that you can conduct.
- Single Sample T Test
- Paired Sample T Test
- Independent Samples T Test
A single sample t test is one in which the mean of a data is compared to another known mean. A paired sample t test is one in which you take two observations of the same sample at different times. The two observations may be spaced before and after an activity or may be spaced over many days, that depends on how you conduct your test. Finally, an independent sample t test requires two separate data samples and it gives you a difference of their averages.
The exact implementation of each of these types has been discussed below.
Conducting a T Test on R
Single Sample T Test on R
Let’s assume that you work for a shipping company that takes in shipments every week for clients and you accept or reject them if the shipments are not up to mark. Suppose one client gets tanks of oil delivered with a mean weight of 57,000 pounds every week. You analyze the shipment for this week and decide to conduct a t test to determine whether the null hypothesis (that the shipment is up to mark) is true or not. You can use the “t.test()” function to determine this.
# t test in R example (Hypothesis testing in R)
> Shipment <- c(rnorm(85, mean = 54000, sd = 1800))
> t.test(Shipment, mu = 57000) #mu is the regular mean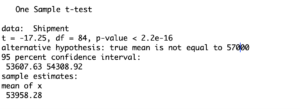
You can see above that the p value is significantly low and therefore the null hypothesis is true, i.e., the recent shipment does in fact have a significantly lower weight and should be rejected.
Paired Sample T Test on R
Now imagine again that you work for a freight service and your job is to figure out a recent issue that the company has been facing. A shipment is expected to expand in volume and weight during a certain route to a destination. You have to determine if this is a significant problem.
# paired t test r example (paired option)
> SourceWeight <- c(rnorm(800, mean = 160, sd = 9.5))
> DestinationWeight <- c(rnorm(800, mean = 164, sd = 9.9))
> t.test(SourceWeight, DestinationWeight, paired = TRUE, conf.level=0.95)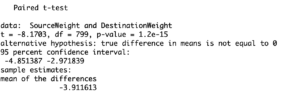
Here you can see that the difference in the two means is significantly different as indicated by the low p value.
Independent Samples T Test
Your independent data sets may have the same variance or a different variance. By default, the function we are using here assumes that the variance is unequal and gives results of the Welch’s test. Otherwise, if you specify that the variance is equal, then you get a t test result with all its parameters.
Here I have created my own data with a normal distribution that I am first going to run with equal variance specified and then without it.
# how to run a two sample t test in R (equal variance specified)
> Data_1 <- rnorm(55, mean = 260, sd = 80)
> Data_2 <- rnorm(55, mean = 310, sd = 90)
> t.test(Data_1, Data_2, var.equal = TRUE)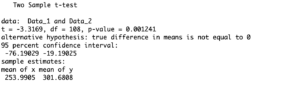
# two sample t test in r - without equal variance
> t.test(Data_1, Data_2, var.equal = FALSE)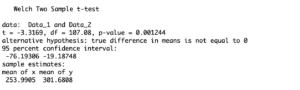
Two Sample t Test in R (Unequal Variance)
Going Deeper…
Interested in Learning More About Statistical Testing in R? Check Out:
The Author:
Syed Abdul Hadi is an aspiring undergrad with a keen interest in data analytics using mathematical models and data processing software. His expertise lies in predictive analysis and interactive visualization techniques. Reading, travelling and horse back riding are among his downtime activities. Visit him on LinkedIn for updates on his work.