Calculating confidence intervals in R is a handy trick to have in your toolbox of statistical operations. A confidence interval essentially allows you to estimate about where a true probability is based on sample probabilities at a given confidence level compared to your null hypothesis. The confidence interval function in R makes inferential statistics a breeze. We’re going to walk through how to calculate confidence interval estimate in R to find the true population parameter. There are a couple of ways this problem can be presented to us….
Calculate Confidence Interval in R – Normal Distribution
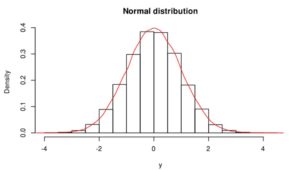
Given the parameters of the population proportion distribution and sample standard deviation, generate the bootstrap confidence interval. In this situation, we’re basically using r like an error interval calculator… Using the 95 percent confidence level and confidence coefficient function, we will now create the R code for a confidence interval. What does a 95 percent confidence interval mean? Essentially, a calculating a 95 percent confidence interval in R means that we are 95 percent sure that the true probability falls within the confidence interval range that we create in a standard normal distribution.
# Calculate Confidence Interval in R for Normal Distribution
# Confidence Interval Statistics
# Assume mean of 12
# Standard deviation of 3
# Sample size of 30
# 95 percent confidence interval so tails are .925

> center <- 12
> stddev <- 3
> n <- 30
> error <- qnorm(0.975)*stddev/sqrt(n)
> error
[1] 1.073516
> lower_bound <- center - error
> lower_bound
[1] 10.92648
> upper_bound <- center + error
> upper_bound
[1] 13.07352
Using this type of quantile function to find the confidence coefficient of a random sample helps us better approximate the true value, which we can further narrow down by performing linear regression and testing the alternative hypothesis. Linear regression will give us a correlation coefficient, and by combining this with the point estimate from our exact confidence interval between each critical value, we can find the true mean statistic, the population standard deviation, and even more from our sample data using this prediction interval.
Thus the range of the sampling distribution based on the true population parameter in this case is between 10.9 and 13.1 (rounding outwards).
Calculate Confidence Interval in R – t Distribution
For experiments run with small sample sizes it is generally inappropriate to use the standard normal distribution or normal approximation. For more accurate small sample hypothesis testing a student T distribution is the correct choice for this environment. A t confidence interval is slightly different from a normal or percentile approximate confidence interval in R. When creating a approximate confidence interval using a t table or student t distribution, you help to eliminate some of the variability in your data by using a slightly different base dataset binomial distribution.
R can support this by substituting the qt function for the qnorm function, as demonstrated below…. assume we are working with a semi large sample size of 15. You will need to tell the qt function the degrees of freedom as a parameter (should be n-1).
# Calculate Confidence Interval in R for t Distribution
# t test confidence interval
# Assume mean of 12
# Standard deviation of 3
# Sample size of 15
# 95% confidence interval so tails are .925

> center <- 12
> stddev <- 3
> n <- 30
> error <- qt(0.975, df=n-1)*stddev/sqrt(n)
> error
[1] 1.661345
> lower_bound <- center - error
> lower_bound
[1] 10.33866
> upper_bound <- center + error
> upper_bound
[1] 13.66134
As expected, the confidence interval and significance level widens… But why calculate a larger confidence interval? Larger confidence intervals increase the chances of capturing the true proportion from the sample proportion, so you can feel more confident that you know what that true proportion is. These confidence interval techniques can be applied to find the exact confidence interval of a mean in R, calculate confidence interval from a p value, or even compute an exact confidence interval for variance in R from a sampling distribution.
Related Materials