Scaling is a way to compare data that is not measured in the same way. The scale function in R handles this task for you by providing a way to normalize the data so that the differences are weeded out. It is a simple solution to a common problem in data science.
Scaling Helps You Make Comparisons
Scaling is the normalization of a data set using the mean value and standard deviation. It is often used with vectors or columns of a data frame. This process helps you compare values without regard to the measurement units used in the process.
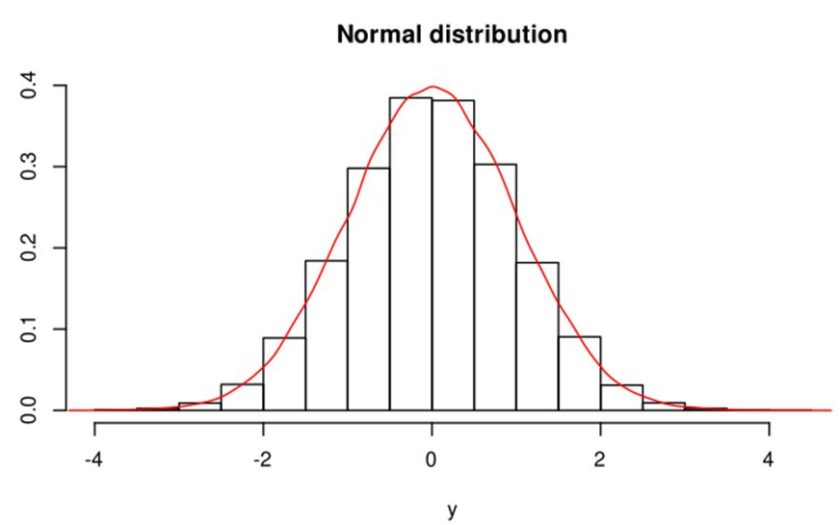
In the process of scaling a vector, you will get negative values if you center the data. It eliminates the effect of a different scale when comparing vectors bringing it closer to a normal distribution. If you are trying to compare reminded data from different measurements, this type of normalization is helpful.
This process is particularly helpful in a regression analysis where the magnitude range of each variable can benefit from being normalized. This type of analysis frequently requires column scaling in a data frame to provide meaningful results. Without normalizing, the vectors or columns you are using you will often get meaningless results.
Using The Scale Function In R
Learning how to scale in R is easy. In its basic form, this function calculates its results based on the mean and standard deviation, keeping the same number of columns. In these calculations, it ignores any missing values and simply includes it in the result. It essentially converts the measurements to standard deviations- if the center is the same for each, your data is now scaled and standardized. This basic form is the one you are most likely to use as well as being the simplest with only one argument.
# how to use scale function in r
df = head(morley)
   x = df$Speed
   scale(x)
   [,1]
   [1,] -0.36575848
   [2,] -1.37159429
   [3,] 0.09143962
   [4,] 1.64591315
   [5,] 0.36575848
   [6,] -0.36575848
   attr(,"scaled:center")
   [1] 890
   attr(,"scaled:scale")
   [1] 109.3618
The main feature of this example is the fact that it includes both positive and negative numbers, despite all of the original numbers being positive. This fact is because the data has been centered around a value of 890, dividing the centered columns into positive and negative ranges. Because some of the values are smaller than the center, they came out negative when column scaling is performed.
Using The Scale Function Without Centering
Sometimes, you may want to scale data without centering it. This has the advantage of that eliminate the presence of negative numbers unless you have actual negative values- some actions performed after centering don’t like negative values. This form of normalization has the advantage that all you are doing is adjusting the scaling while maintaining existing positive and negative numbers (scale is true, center is not). This is probably the approach you want to take if your source contains no negative numbers.
# how to use scale function without centering
df = head(morley)
   x = df$Speed
   scale(x, center = FALSE)
   [,1]
   [1,] 0.8664092
   [2,] 0.7542857
   [3,] 0.9173745
   [4,] 1.0906563
   [5,] 0.9479536
   [6,] 0.8664092
   attr(,"scaled:scale")
   [1] 981.0607
In this example, we have eliminated negative values by turning off the centralization. You need to note that it does produce different scales, so when applying this to columns or vectors that you want to compare, you need to be consistent in how you set the parameter that determines how column scaling is set.
Using The Scale Function Without Actually Scaling
In this case, no actual scaling occurs, so it does not help when comparing values measured in different ways. It does, however, give you a central point around which your data will be found (center is true, scale is not). This fact can be helpful in and sowing how individual data points compared to the average value. For example, it may produce a lot of small negative results against a few large positive ones.
# r scale function without scaling
df = head(morley)
   x = df$Speed
   scale(x, scale = FALSE)
   [,1]
   [1,] -40
   [2,] -150
   [3,] 10
   [4,] 180
   [5,] 40
   [6,] -40
   attr(,"scaled:center")
   [1] 890
In this example, none of the values have been scaled but simply shifted down by 890. Unlike the previous examples, scaling is false- no scaling occurs. It reveals a good deal of balance on both sides of the center mark. In such a simple case the printed figures are sufficient to see this, but with larger data sets, a graph would be needed to see the results.
Using The Scale Function Without Scales Or Centers
In this case, we have no scales or centers. At first glance, this fact may make this approach seem entirely useless. However, it does have the effect of turning a vector into a single column array. This means that while its uses may be limited, it is not entirely useless. Even if you never have a reason to use this function in such a manner, it is still another possible tool in your R arsenal.
# scale function in r without scaling or centering
df = head(morley)
   x = df$Speed
   scale(x, center = FALSE, scale = FALSE)
   [,1]
   [1,] 850
   [2,] 740
   [3,] 900
   [4,] 1070
   [5,] 930
   [6,] 850
In this example, all we really did create a single column array from a dataframe column. However, this is not a useless process since you have just liberated that column from the dataframe.
Manual Column Scaling Or Centering
Here is a way of accomplishing the same task manually. In fact, this code contains the actual algorithm used by the scale function in r. The main advantage of this approach is that you can include a log scale or any other adjustments that you want. It also differs from the function in that it can maintain the same data structure as the input. You can easily add it to a data frame if you want to.
# manual scaling in r
df = head(morley)
   x = df$Speed
   (x - mean(x)) / sd(x)
   [1] -0.36575848 -1.37159429 0.09143962 1.64591315 0.36575848
   [6] -0.36575848
One of the advantages of using this approach is that you have more control over what your code is doing. Except for in the simplest case, it is actually the shorter segment of code. The best method for you to use depends on what you are trying to do and the desired output format.
Normalized values for proper statistical comparison are essential to obtain meaningful and accurate results. The need for proper comparisons makes these functions an important part of the processing of information. Without it, you will be stuck with values that cannot be compared.