Ever needed to add straight lines to an R plot ? You can use abline in R to add straight lines to a scatter plot, residual plot, ot line plot. What is ab line? It helps you plot any R line type, and with it making lines in R has never been easier. This R line type function is great for adding cutoffs or similar limits to an existing R plot, line chart, line graph, or any type of scatter plot function involving axes, axis labels, line segments, and any other graphical parameter you can think of. Unlike with some different line types and plotting symbol methods, this one does not require the ggplot2 package, it is part of the default value R install.
# abline in r / r plot add line

abline(a = NULL, b = NULL, h = NULL, v = NULL, reg = NULL,
       coef = NULL, col = NULL, lty = NULL, lwd= NULL)
The abline function can accept several arguments, with defaults of NULL:
- a – The intercept of the line, as a single value
- b – The slope of a line, as a single value
- h – the y-value(s) for horizontal line(s)
- v – the x-value(s) for vertical line(s).
- coef – a vector of length two giving the intercept and slope
- reg – a regression object generated by the coef method; intended to simplifying passing trend-lines from a regression calculation
- col – optional color parameter for the line
- lty – optional line type parameter
- lwd – optional line width parameter
Initial Setup – Examples
We’re going to use the airmiles dataset for this tutorial on how to plot a line in r code. You can use a number of different numeric vector or variable types, though because it is a line you are subject to some size and axis limits, and cannot use a character vector type argument to create the line or curve. You also cannot create any sort of legend text or legend function with this particular abline function, or create different line types like a boxplot. This is one of the default datasets available in R.
> airmiles

# default plot for abline in r tutorial
> plot (airmiles)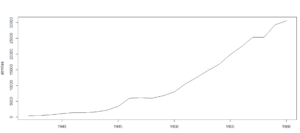
As you can see, airmiles is a nice basic timeseries data frame. It shows the growth of airline travel within the US in a linear model.
Abline in R – Add Horizontal Lines
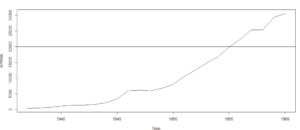
How do you add a horizontal line to an existing plot in R code? First, lets start by drawing a horizontal line on the graph. Maybe we are very interested in seeing when the total miles traveled is above 20,000.
# abline in R example - horizontal line
abline(20000,0)
This draws a lovely horizontal line at the y = 20000 level.
Abline in R – Add Vertical Lines
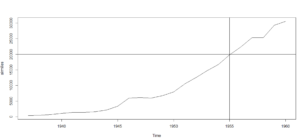
Now for some tips on vertical line segment drawing. We can also easily add a vertical line to the graph, similar to a dropline in Excel. Perhaps our client would like to see a line at the year 1955.
# abline in R example - horizontal line
abline(v = 1955)
This draws a lovely vertical line at the x = 1955 level.
Abline in R – Color and Line Types
Moving past basic black and white, we can easily adapt the abline function to draw lines in color and in different formats. We can edit our R plot line thickness, do a dotted abline in R, and add color to abline in R.
plot(airmiles)
abline(v=1955, col='blue', lty=2, lwd=5)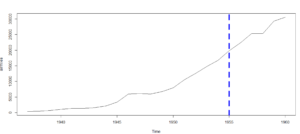
Abline in R – Multiple Lines
In this next example, we’re going to draw a range of two lines on the chart. There’s syntax that can simplify this for horizontal lines.
plot(airmiles)
abline(c(5000, 25000), col='blue', lty=2, lwd=4)
abline(5000, 0, col='blue', lty=2, lwd=4)
abline(25000, 0, col='blue', lty=2, lwd=4)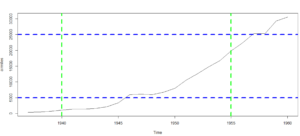
Abline in R – Drawing a slope
For our next example, we will demonstrate how to draw a sloped trend line. The abline function in R can help us plot a sloped reference line, which can help us plot a linear regression model in R. How do you add a trend line in R? The ab line logistic regression tool can help us with that too.
A slope of 1 is a 45 degree line.
with(airquality, plot(Ozone, Temp))
abline(60, .5, col='blue', lty=2, lwd=4)
abline(60, 0, col='blue', lty=2, lwd=4)
abline(60, 1, col='blue', lty=2, lwd=4)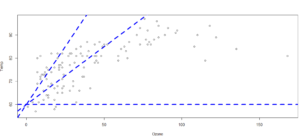
Abline in R can help us with a great many things. Whether you want to do abline on a histogram in R, change your R plot line thickness, or even learn how to draw in R, abline in R is a great place to start. R lines will become your best friend when plotting a data point or residuals, and learning simple tricks like how to limit abline in R, how to do a linear regression line in R, or how to make an R 45 degree linear model on a scatterplot will all make you a much better data scientist!
We hope our tutorial on abline in R was helpful, and encourage you to check out some of our other tips and tricks for everything R programming related!