SSomething I have talked about a lot is that R gives you many ways to go about a single task and your job as an R programmer is to find the easiest way to do it. The sweep function in R is something that saves us many lines of code when we’re working with arrays and matrices.
However, before I dive into the usage and working of the sweep function, I want to take a minute and present a scenario. We’ll first be going about it by using a longer but more basic method, we’ll then simplify the job using the sweep function. I find this approach to be more helpful for developing problem solving skills when coding.
The Hard Way
Imagine that you’re an instructor and you have stored the scores of all the students in 5 different components of the course in a matrix. Now you just realized that there was an issue while maintaining your records of the grades and you need to add 2, 3, 4, 5 and 6 to the components from 1 till 5 respectively for all the students. In simpler terms, you need to add 2, 3, 4, 5 and 6 to the columns 1 till 5 of your grade’s matrix. Possibly the most basic method in R should be to use the ‘apply’ function.
The apply function takes in a data matrix, a row/column specifier (specifying whether you want to perform a function over all the rows or the columns) and the operation that is to be performed. Here is an example of how the apply function can be used to calculate the aggregate score of all the students in each component of the course. For simplicity here I have assumed that the class only has three students.
> StudentScores <- matrix(c(3,4,5,7,6), c(3,5,5,5,1), c(5,3,1,2,9))
> StudentScores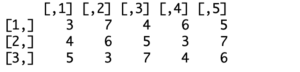
> aggregate <- apply ( StudentScores , 2 , mean)
> aggregate
[1] 4.000000 5.333333 5.333333 4.333333 6.000000
Using the apply function, I have calculated the average score of the class in each component. Now, going back to the original task at hand, how can you add scores for each student over all the components. Here you can see that ‘mean’ is a function into which the columns of our matrix are fed, and it returns the average score, so we need something similar for the addition. It would be a function that takes each row of the matrix and adds different values to each consecutive element. Since R doesn’t give you a native function like mean to go about such operations on a data, we’ll need to specify a function. It should look like this.
> Addition <- function(row){
+ row=row+c(2,3,4,5,6)
+ return(row)
+ }
With the function defined, I can now use it with apply to add the values.
> CorrectedScores <- apply (StudentScores, 1, Addition)
> CorrectedScores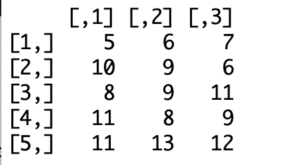
[Here, the apply function did the job but something I want you to notice is that the final matrix is a transpose of the matrix that was fed into the function. This isn’t a glitch, rather the apply function is documented to work this way. You can transpose is to get the original dimensions.
Here was an example of how a simple task required more lines of code than one would normally expect. We’ll now try solving the same problem using the sweep function.
Using Sweep in R
The sweep function takes 4 positional arguments, the data, the row/column specification, the array to be applied to the rows or columns and the operation to be performed. What we did up there can be done in one line of code as you can see below.
> sweep (StudentScores, 2, c(2,3,4,5,6), "+")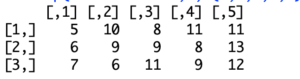
[In a similar manner, you can perform operations like multiplication and subtraction etc. The sweep function also does not change the dimensions of your data.
Going One Step Further
Now that you have some basic understanding of the sweep function and have seen some problem-solving using it, I’ll proceed to a bit more technical tasks that you can perform using the sweep function. This is done with the aim of giving you a better insight on the different number of ways that you can use sweep.
Suppose you have your grades matrix and you want to standardize your data column wise in that matrix. Although R gives you easier ways to do that, I’ll be using the sweep function for the sake of better understanding of how the function works.
When you’re standardizing a data matrix, you’ll use the following formula.
Standardized Value = (Data Value – Median of Sample) / Median Absolute Deviation
Here, the median of sample is simply the median of the column in which the data value is taken from.
I’ll be creating a function that performs this operation on all the columns of our matrix.
> StandardizingFunction <- function(value) {
+ ColMedian <- apply(value, 2, median)
+ ColDev <- apply(value, 2, mad)
+ Result <- sweep(value, 2, ColMedian,"-")
+ Result <- sweep(Result, 2, ColDev, "/")
+ return(Result)
+ }
Now testing the function with our grades matrix.
> StandardizingFunction (StudentScores)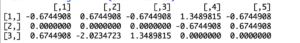
[What I hope to have made very clear in this article is the fact that R provides many ways to go about something and when you’re writing a code, you should always do your research to find the simplest way to do it. It not only saves time, but one characteristic of a good programmer is that their code is easy to understand and keeping it minimalistic is equivalent to keeping things easy to understand.