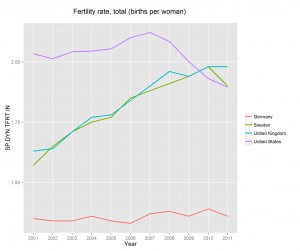
I was recently asked by a client to create a large number of “proof of concept” visualizations that illustrated the power of R for compiling and analyzing disparate datasets. The client was specifically interested in automated analyses of global data. A little research led me to the WDI package.
SPARQL with R in less than 5 minutes
In this article we’ll get up and running on the Semantic Web in less than 5 minutes using SPARQL with R. We’ll begin with a brief introduction to the Semantic Web then cover some simple steps for downloading and analyzing government data via a SPARQL query with the SPARQL R package.

R Helper Functions
If you do a lot of R programming, you probably have a list of R helper functions set aside in a script that you include on R startup or at the top of your code. In some cases helper functions add capabilities that aren’t otherwise available. In other cases, they replicate functionality that is available […]
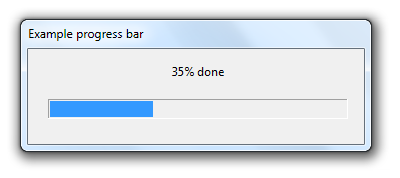
Progress bars in R using winProgressBar
Using progress bars in R scripts can provide valuable timing feedback during development and additional polish to final products. winProgressBar and setWinProgressBar are the primary functions for creating progress bars in R. Progress bars, and progress indicators in general, are relatively uncommon in R programming. This makes sense, as they can add bloat and, being […]

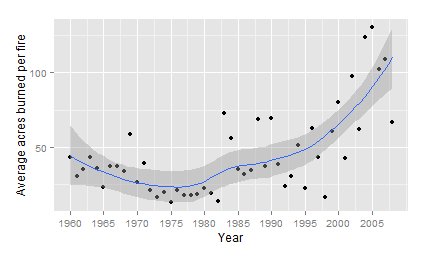
Animations in R – How to Make Animated Graphs
Animated graphs can be very helpful in illustrating concepts or discovering relationships, which makes them very helpful in teaching and exploratory research. Fortunately, creating animated graphs in R is fairly straightforward, once you have the right tools and understand a few basic principles about how the animations are created.
RStudio Development Environment
Compared to many other languages of equal popularity, there are realtively few development environments for R. In fact, the total number of production ready R IDEs could probably be counted on one hand. That deficiency is a small price to pay to use R and if you’re not already accustomed to using IDEs for other […]
Installing quantstrat from R-forge and source
R is used extensively in the financial industry; many of my recent clients have been working in or developing products for the financial sector. Some common applications are to use R to analyze market data and evaluate quantitative trading strategies. Custom solutions are almost always the best way to do this, but the quantstrat package […]
Subscriptions Feature Added
You can now subscribe to almost any content on the ProgrammingR website, including the job listings. To be notified of job listings as soon as they are posted, click the “R Jobs” link above and follow the instructions on that page to add the jobs feed to your feed reader.Because of this change, I will […]

Building Scoring and Ranking Systems in R
This guest article was written by author and consultant Tristan Yates (see his bio below). It emphasizes R’s data object manipulation and scoring capabilities via a detailed financial analysis example. Scoring and ranking systems are extremely valuable management tools. They can be used to predict the future, make decisions, and improve behavior – sometimes all […]

Webscraping using readLines and RCurl
First article in a series covering scraping data from the web into R; Part II (scraping JSON data) is here, Part III (targeting data using CSS selectors) is here, and we give some suggestions on potential projects here. There is a massive amount of data available on the web. Some of it is in the form of formatted, downloadable […]